
Introduction
Protein developability refers to the physicochemical and biochemical properties that influence a protein's suitability for development, manufacturing, and clinical use. In addition to strong target affinity, a viable therapeutic protein must exhibit favorable solubility, stability, manufacturability, and low risk of aggregation and other potential liabilities.
The resulting output provides an overview of the predicted developability profiles of the screened proteins, based on computational approaches that incorporate both sequence- and structure-based analyses. The evaluated metrics combine machine learning models trained on clinical-stage antibody data with physicochemical property assessments.
Submit a job
Bellow is a figure of the Protein Developability analysis on the portal. The version may change during the development of the workflow, but the latest version is always recommended to use.
Clicking on the RUN Analysis button, we can launch a Protein Developability analysis.

Inputs
The recommended input of the analysis is 3D structures of proteins to assess the developability properties. It can be a single protein PDB file or a ZIP or TAR file containing multiple PDB structures for developability assessment. Both structure-based and sequence-based predictions will be performed. The input proteins should belong to the same class.
The analysis can also accept protein sequences as an alternative input but only sequence-based predictions (solubility and motif liabilities) will be performed. If you only have sequences, you can run Alphafold prediction to model protein 3D structures and then use them as the above structural input
The input sequences can be either in CSV or FASTA format:
- Select a single CSV file containing protein sequences for developability assessment. The CSV file must have columns named "protein_name", "chain_sequence" (for sequence) and "chain_name" (for chain ID name such as A, B, H, L; leave empty or exclude the "chain_name" column for single-chain proteins). Only sequence-based predictions will be performed. The input proteins should belong to the same class.
- or select a single FASTA file containing protein sequences for developability assessment. For multimeric proteins, FASTA headers must end with a suffix “_<ID>” to indicate different chains. Protein with multiple chains must share the same base name, for example ">protein1_A", ">protein1_B", etc. There is no specific requirement for proteins with a single chain but they should not share the same base name before the last underscore "_" suffix with other proteins. Only sequence-based predictions will be performed. The input proteins should belong to the same class.
Note: The input proteins (both in 3D structure and sequence input cases ) should belong to the same class (e.g., peptides, Fc fusion proteins) so that relevant reference (clinical-stage) protein sets could be used properly to compare. By default, predicted metrics will be compared to those of general proteins (about 100-500 amino acids) from clinical-stage therapeutics. If your inputs are peptides or large proteins, select the “Peptides” or “Large Proteins” option, respectively.
Example of a valid input fasta file:
>6owd_A
QIARLQRQIRALQRQNARLQRQIRALQW
>6owd_B
QIARLQRQIRALQRQNARLQRQIRALQW
>4DME_A
RMKQLEDKVEELLSKNYHLENEVARLKKLVGER
>4DME_B
RMKQLEDKVEELLSKNYHLENEVARLKKLVGER
>4DME_C
RMKQLEDKVEELLSKNYHLENEVARLKKLVGER
>Nesiritide_monomer
SPKMVQGSGCFGRKMDRISSSSGLGCKVLRRH
>Teriparatide
SVSEIQLMHNLGKHLNSMERVEWLRKKLQDVHNF
Example of a valid input CSV file:
protein_name,chain_sequence,chain_name
4DME,RMKQLEDKVEELLSKNYHLENEVARLKKLVGER,A
4DME,RMKQLEDKVEELLSKNYHLENEVARLKKLVGER,B
4DME,RMKQLEDKVEELLSKNYHLENEVARLKKLVGER,C
6owd,QIARLQRQIRALQRQNARLQRQIRALQW,A
6owd,QIARLQRQIRALQRQNARLQRQIRALQW,B
Nesiritide_monomer,SPKMVQGSGCFGRKMDRISSSSGLGCKVLRRH,
Teriparatide,SVSEIQLMHNLGKHLNSMERVEWLRKKLQDVHNF,
or some Fc fusion proteins:
protein_name,chain_name,chain_sequence,
eftrenonacog,A,YNSGKLEEFVQGNLERECMEEKCSFEEAREVFENTERTTEFWKQYVDGDQCESNPCLNGGSCKDDINSYECWCPFGFEGKNCELDVTCNIKNGRCEQFCKNSADNKVVCSCTEGYRLAENQKSCEPAVPFPCGRVSVSQTSKLTRAETVFPDVDYVNSTEAETILDNITQSTQSFNDFTRVVGGEDAKPGQFPWQVVLNGKVDAFCGGSIVNEKWIVTAAHCVETGVKITVVAGEHNIEETEHTEQKRNVIRIIPHHNYNAAINKYNHDIALLELDEPLVLNSYVTPICIADKEYTNIFLKFGSGYVSGWGRVFHKGRSALVLQYLRVPLVDRATCLRSTKFTIYNNMFCAGFHEGGRDSCQGDSGGPHVTEVEGTSFLTGIISWGEECAMKGKYGIYTKVSRYVNWIKEKTKLTDKTHTCPPCPAPELLGGPSVFLFPPKPKDTLMISRTPEVTCVVVDVSHEDPEVKFNWYVDGVEVHNAKTKPREEQYNSTYRVVSVLTVLHQDWLNGKEYKCKVSNKALPAPIEKTISKAKGQPREPQVYTLPPSRDELTKNQVSLTCLVKGFYPSDIAVEWESNGQPENNYKTTPPVLDSDGSFFLYSKLTVDKSRWQQGNVFSCSVMHEALHNHYTQKSLSLSPG
eftrenonacog,B,DKTHTCPPCPAPELLGGPSVFLFPPKPKDTLMISRTPEVTCVVVDVSHEDPEVKFNWYVDGVEVHNAKTKPREEQYNSTYRVVSVLTVLHQDWLNGKEYKCKVSNKALPAPIEKTISKAKGQPREPQVYTLPPSRDELTKNQVSLTCLVKGFYPSDIAVEWESNGQPENNYKTTPPVLDSDGSFFLYSKLTVDKSRWQQGNVFSCSVMHEALHNHYTQKSLSLSPG
abatacept,A,MGVLLTQRTLLSLVLALLFPSMASMAMHVAQPAVVLASSRGIASFVCEYASPGKATEVRVTVLRQADSQVTEVCAATYMMGNELTFLDDSICTGTSSGNQVNLTIQGLRAMDTGLYICKVELMYPPPYYLGIGNGTQIYVIDPEPCPDSDQEPKSSDKTHTSPPSPAPELLGGSSVFLFPPKPKDTLMISRTPEVTCVVVDVSHEDPEVKFNWYVDGVEVHNAKTKPREEQYNSTYRVVSVLTVLHQDWLNGKEYKCKVSNKALPAPIEKTISKAKGQPREPQVYTLPPSRDELTKNQVSLTCLVKGFYPSDIAVEWESNGQPENNYKTTPPVLDSDGSFFLYSKLTVDKSRWQQGNVFSCSVMHEALHNHYTQKSLSLSPGK
abatacept,B,MGVLLTQRTLLSLVLALLFPSMASMAMHVAQPAVVLASSRGIASFVCEYASPGKATEVRVTVLRQADSQVTEVCAATYMMGNELTFLDDSICTGTSSGNQVNLTIQGLRAMDTGLYICKVELMYPPPYYLGIGNGTQIYVIDPEPCPDSDQEPKSSDKTHTSPPSPAPELLGGSSVFLFPPKPKDTLMISRTPEVTCVVVDVSHEDPEVKFNWYVDGVEVHNAKTKPREEQYNSTYRVVSVLTVLHQDWLNGKEYKCKVSNKALPAPIEKTISKAKGQPREPQVYTLPPSRDELTKNQVSLTCLVKGFYPSDIAVEWESNGQPENNYKTTPPVLDSDGSFFLYSKLTVDKSRWQQGNVFSCSVMHEALHNHYTQKSLSLSPGK
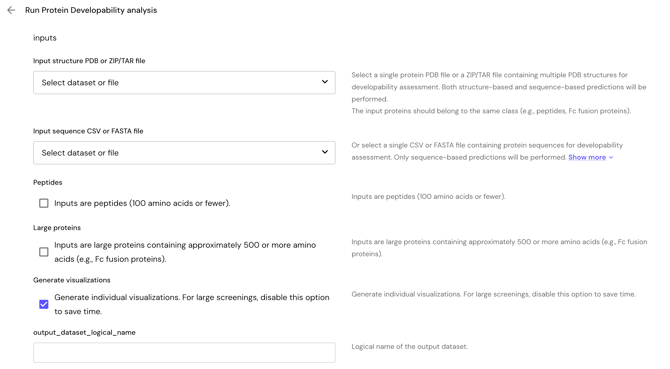
- Peptides option: If the inputs are peptides, some predicted relevant properties (ie. aggregation, solubility) will be compared against the reference clinical-stage peptides
- Large proteins option: if inputs are large proteins containing approximately 500 or more amino acids (e.g., Fc fusion proteins), predicted relevant properties (ie. aggregation, solubility) will be compared against the reference clinical-stage large proteins
In the input field, a single input file should be selected (NOT dataset name).

By default, the workflow will generate reports, including a summary and individual reports for the input antibody sequences. If there are more than 500 input antibodies, the workflow will automatically skip making individual reports to save time. Also, when screening too many input sequences, one should disable the Generate individual visualizations option since these tasks take time and these visualizations may be not useful for the screening purpose. In this case, the three tabs “AGGREGATION PROPENSITY,” “LIABILITY PLOTS,” and “HYDROPHOBICITY AND CHARGE” for individual visualizations and individual reports will be unavailable. The summary report is always generated.
Expected outputs
The expected outputs are as below:
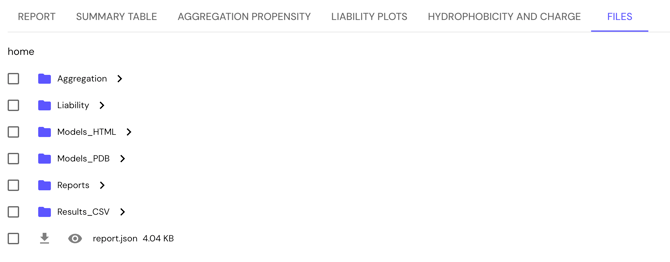
- report.json: The main report containing overview information and main results of the developability assessments.
- Liability: motif liabilities or each proteins in raw csv files and plotted figures. All liability visualizations on sequences can be found in the LIABILITY PLOTS tab
- dev_motifs.csv: Chemical developability (DEV) motif liabilities along with antibody sequences.
- ns_motifs.csv: Non-specificity (NS) motif liabilities along with with antibody sequences.
- Aggregation: Averaged and per-residue aggregation score of each protein in csv files and plotted figures. The interactive plots of per-residue aggregation score can be directly found in the AGGREGATION PROPENSITY tab
- Reports: Consists of individual report of each screened antibody. The individual report provides a more detailed description of the developability properties, particularly the comparison of its properties with those of clinical-stage proteins.
- Results_CSV: The predicted deveopability metrics/parameters in the CSV format:
- main_results.csv: main predicted metrics which is also shown in the summary report and the SUMMARY TABLE tab
- consolidated_metrics.csv: All predicted metrics/parameters in a single consolidated csv file
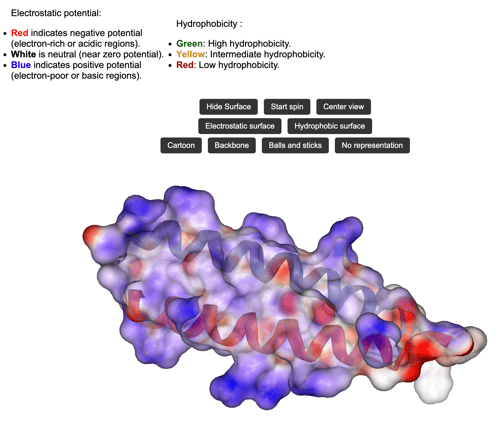
- Models_HTML: Consists of the html visualization of each predicted protein structure with some features to visualize electrostatic potentials and hydrophobicity.
- Model_PDB: Consist of PDB models with PSH (Patches of Surface Hydrophobicity), PPC (Patches of Negative Charge) and PNC (Patches of Positive Charge) features mapped as B-factor. These features can be visualized by using integrated Mol* on the portal or Pymol (locally). The surface hydrophobicity patches can also be viewed directly from the SUMMARY TABLE (column: PSH PDB model) or HYDROPHOBICITY AND CHARGE tabs

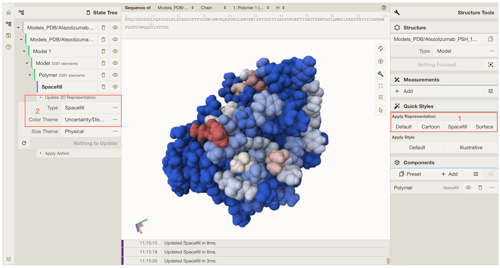
Visualize B-factors using Mol*
- We can use a natural command like “show b-factor as uncertainty” in the Question box.
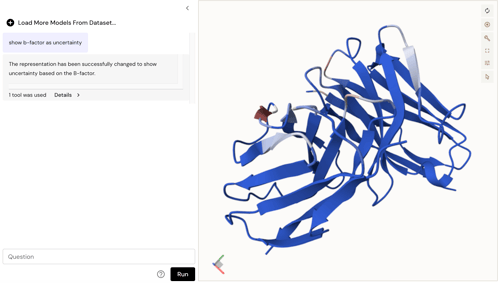
- We can also use interface buttons:
- Type: Spacefill or Surface or Cartoon, …
- Color Theme: Uncertainty/Disorder
Visualize B-factors using Pymol
Use simple command lines:
spectrum b, blue_white_red # or white_red
as surface # or as spheres
Comprehensive description
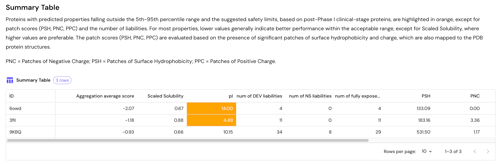
The output provides an overview of the predicted developability profiles of the screened proteins, based on computational approaches that incorporate both sequence- and structure-based analyses. Developability metrics for proteins include the Aggregation Average Score, which estimates overall aggregation propensity; Scaled Solubility, which predicts protein solubility; and pI, which are particularly informative for assessing non-specific binding risk.
The following properties are assessed:
-
Aggregation average score: Represents the mean residue-level aggregation propensity across the protein structure, providing a normalized estimate of the molecule’s overall aggregation tendency. More negative scores suggest reduced aggregation risk.
-
Scaled Solubility: A normalized solubility score (ranging from 0 to 1) indicating predicted solubility based on sequence features. Higher values indicate better solubility.
-
pI: Isoelectric point. It is the pH at which a molecule, typically a protein, carries no net electric charge. Relates to solubility, stability, and behavior in electrophoretic or chromatographic systems. pI is also associated with Heparin Affinity Chromatography (HAC), which is used to assess non-specific binding.
-
PSH : Patches of Surface Hydrophobicity. Measures the size of solvent-exposed hydrophobic residues in the proteins. High levels of hydrophobicity, have been implicated in aggregation, viscosity, and polyspecificity.
-
PNC : Patches of Negative Charge. Measures the size of solvent-exposed negatively charged residues in the proteins. Patches of Negative Charge in the binding regions can be linked to high rates of clearance and poor expression levels
-
PPC : Patches of Positive Charge. Measures the size of solvent-exposed positively charged residues in the proteins. Patches of Positive Charge in the binding regions can be linked to high rates of clearance and poor expression levels
-
num of DEV liabilities : Number of detected motifs associated with developability (DEV) liabilities (including both solvent-exposed and non-exposed motifs).
-
num of fully exposed DEV liabilities : Number of detected motifs with fully solvent-exposed residues associated with DEV liabilities. These exposed motifs represent a higher potential risk, as they are more susceptible to solvent-driven chemical degradation.
-
num of NS liabilities : Number of detected motifs associated with non-specificity (NS) liabilities (including both solvent-exposed and non-exposed motifs).
Liabilities
The following tables summarize the developability and non-specificity motifs identified. Each row corresponds to each chain of the protein (ID). For each protein chain, the tables list potential liabilities, specific motifs in the sequence, and their start and end positions. Surface exposure describes whether the motif is solvent-exposed, which generally represents a higher potential risk due to increased susceptibility to solvent-driven chemical degradation. The Severity column is categorized as high, medium, low, or undefined and indicates the inherent developability concern associated with each motif, where higher severity reflects a greater potential to cause issues and lower severity indicates a lesser concern. The Risk level is an overall assessment of the potential risk associated with each motif, derived by combining severity with the surface exposure factor if the protein structures are provided. The severity and risk level of motifs are meaningful when the motifs are located in sensitive or binding regions of the protein. When a column contains multiple values inside brackets [], they are listed in the same order across all columns, meaning the first entry in each column corresponds to the same motif and liability. When a column contains multiple values inside brackets [], they are listed in the same order across all columns, meaning the first entry in each column corresponds to the same motif and liability. Empty brackets [] indicate that no motif or corresponding value was detected for that column.
The developability liabilities include the following common risk motifs: glycosylation, deamidation, isomerization, low solubility, high viscosity, glycation, integrin binding, CD11c/CD18 binding and fragmentation.
The non-specificity liabilities include non-specificity and polyreactivity-inducing motifs.
The liability visualization can be seen in the LIABILITY PLOTS tab